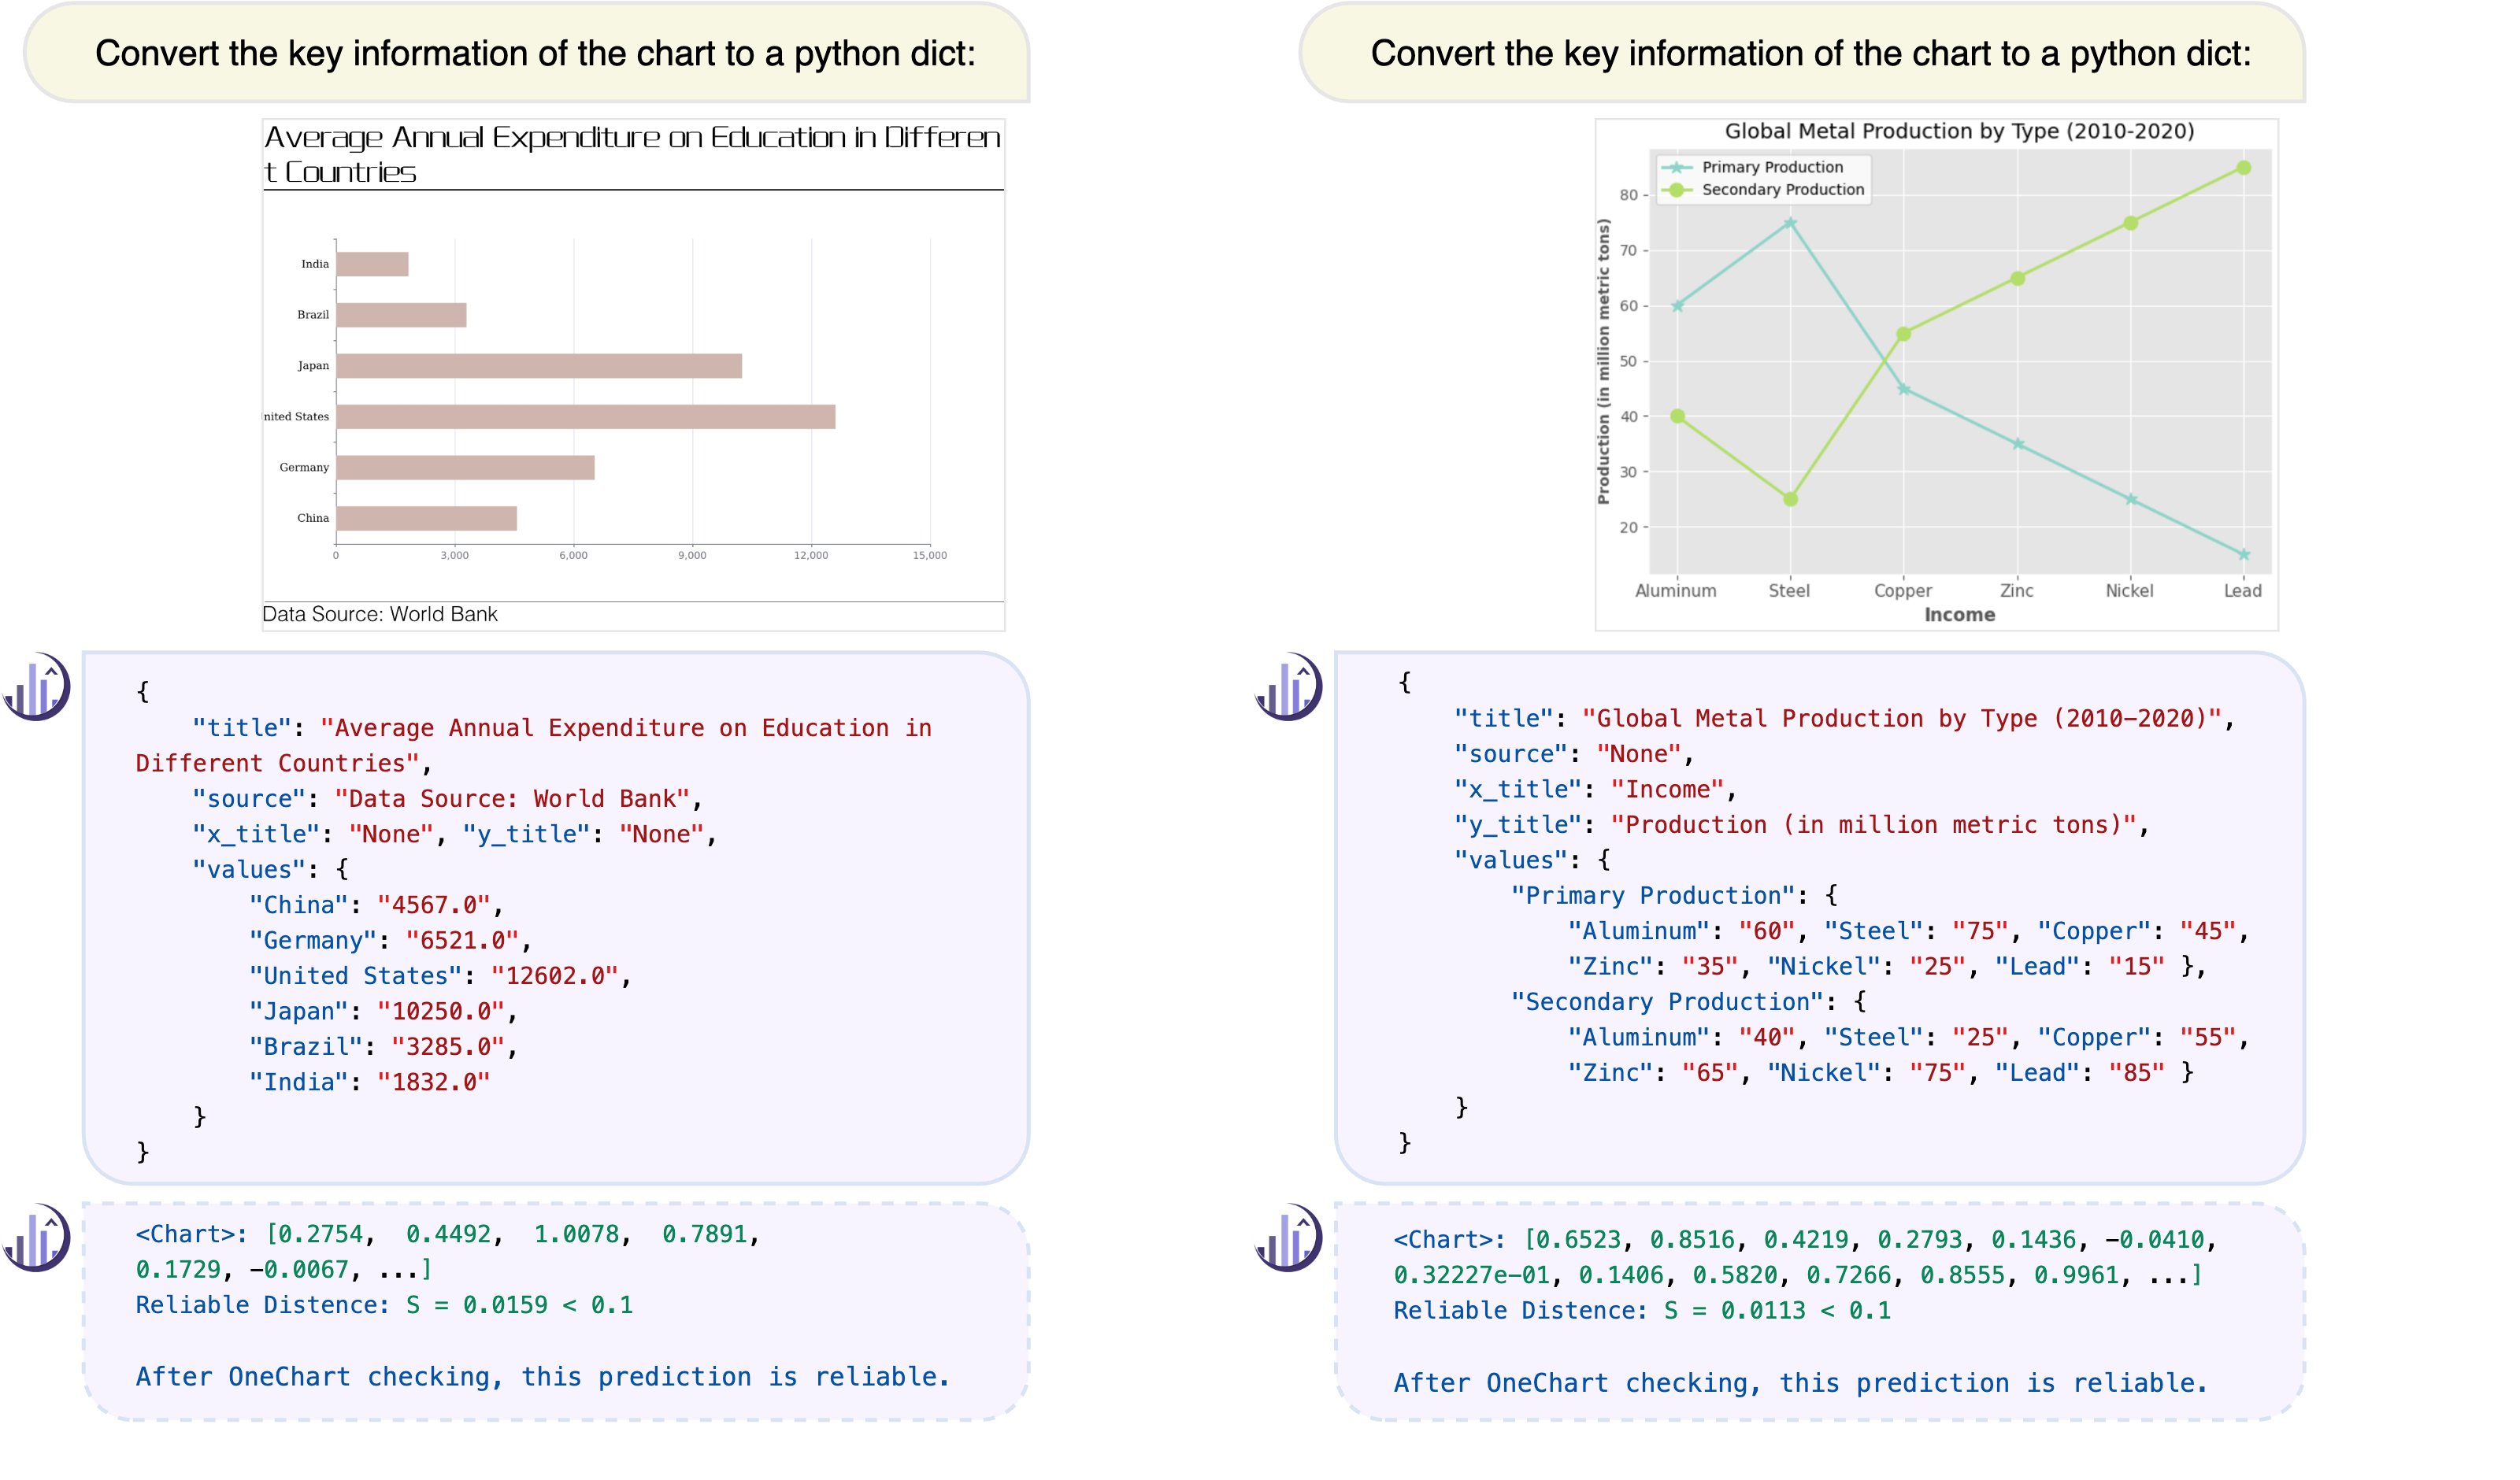
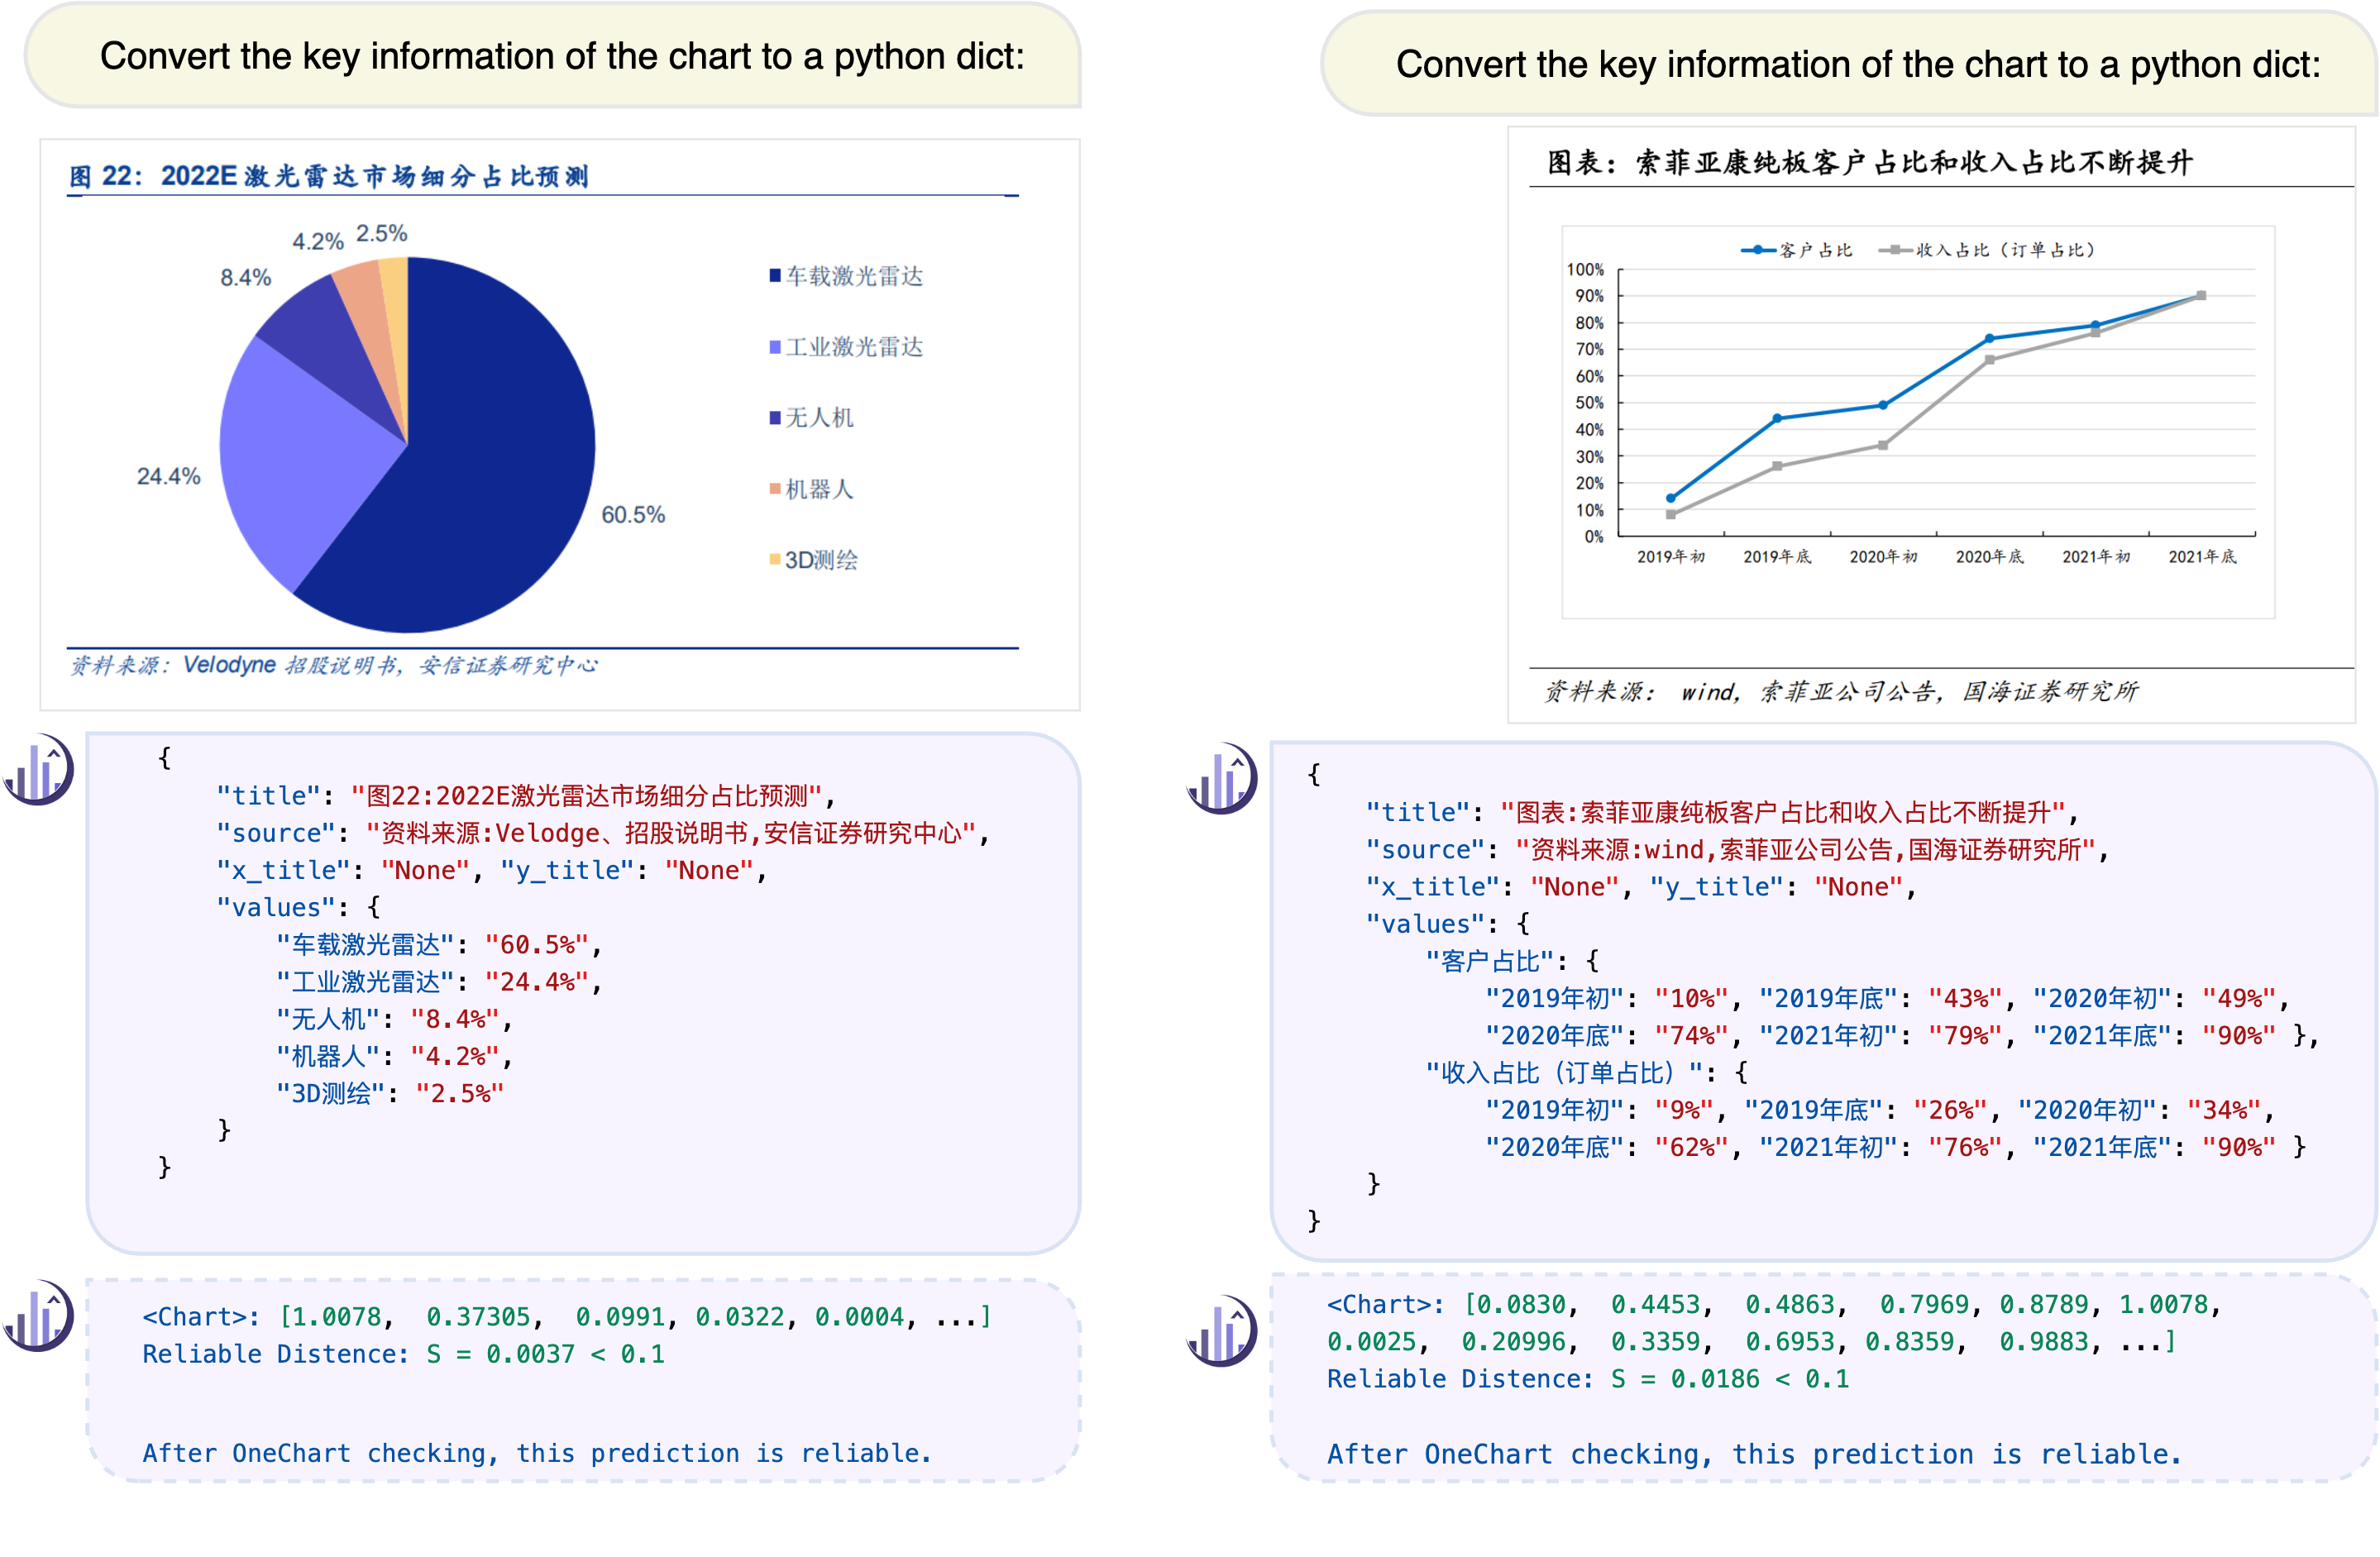
Chart parsing poses a significant challenge due to the diversity of styles, values, texts, and so forth. Even advanced large vision-language models (LVLMs) with billions of parameters struggle to handle such tasks satisfactorily. To address this, we propose  OneChart, a reliable tool specifically devised for the structural extraction of chart. It captures essential components like chart titles, sources, and aligned numerical data and outputs them to a Python-dict format, which can effectively facilitate downstream chart reasoning tasks.
We train a specialized chart encoder using a large amount of synthetic chart data in both English and Chinese. To enhance the numerical parts of the textual output, we introduce an auxiliary token along with an additional decoder. The auxiliary token allows subsequent text tokens to capture enhanced numerical features through causal attention. Furthermore, with the aid of one auxiliary token, we devise a reliable check mechanism during inference by providing self-consistency distance for the generated content.
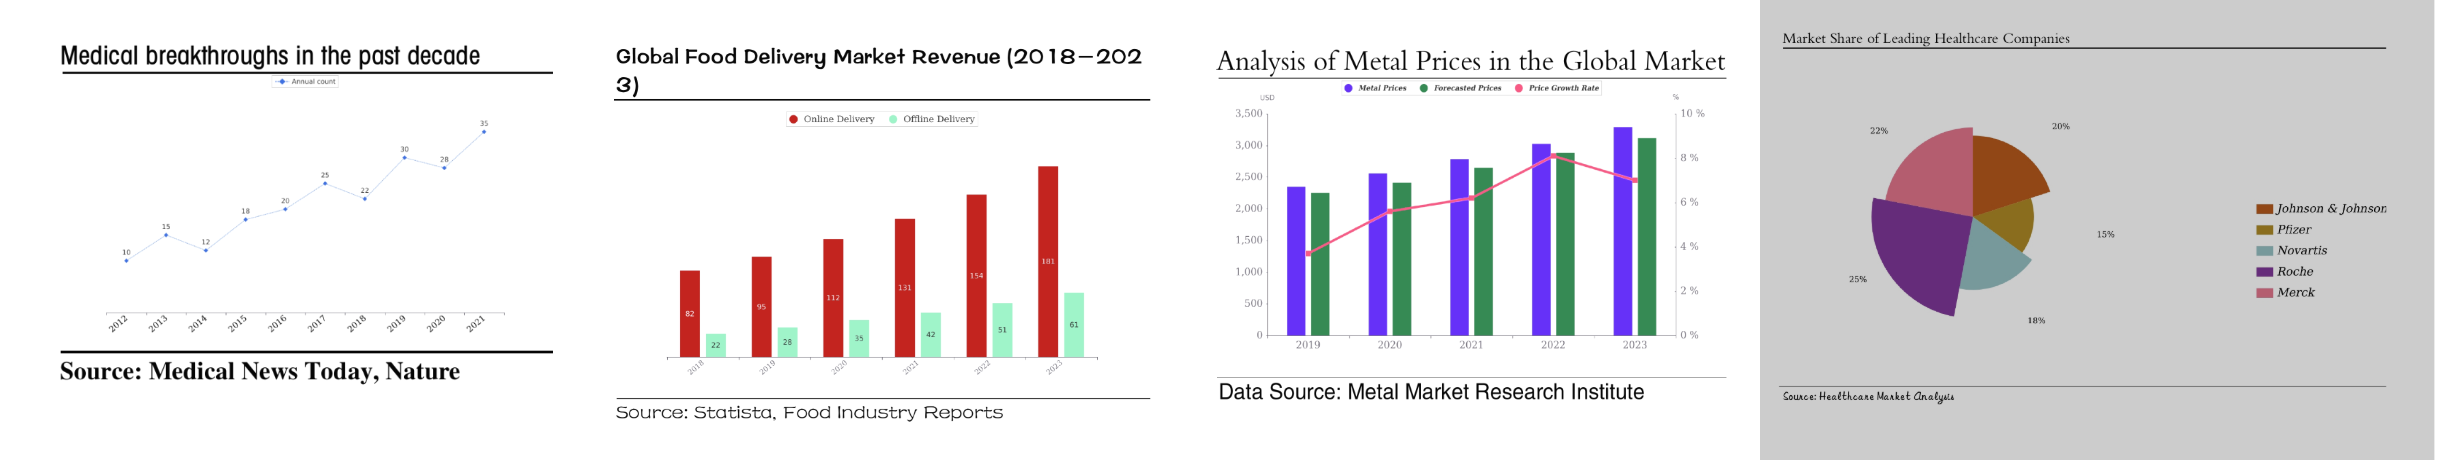
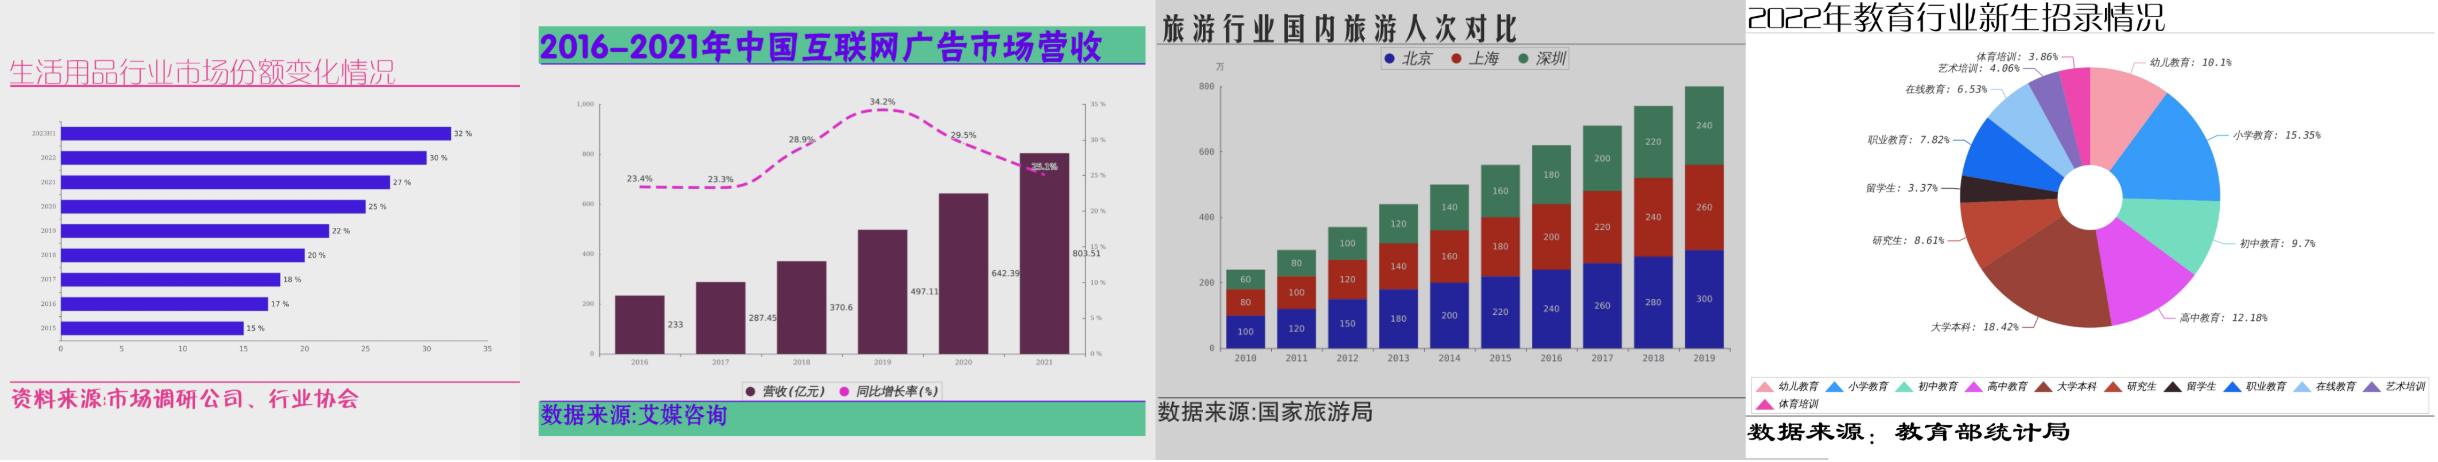
Moreover, we present a large-scale chart-to-dict benchmark. These charts span a broad spectrum of topics and types and include content in both English and Chinese. Experiments reveal that
OneChart achieves SOTA performance in structural extraction, despite enjoying only 0.2B parameters.
It shows a 19.1% ~ 29.4% improvement in Average Precision (AP) compared to suboptimal methods in charts lacking numerical annotations. As a chart parsing agent, it also brings 11.2% accuracy gains for LLaVA-1.6 and 32.6% for LLaVA-1.5 in the downstream ChartQA benchmark.